Today, in order to offer an interactive user experience, web apps need a lot of client side code. Javascript is the most expensive resource in modern applications. The cost of Javascript, to paraphrase Addy Osmani [2], is low performances.
Our blazing fast shiny laptops crunch numbers easily. But Web developers are not a representative sample of the World population. So, even if our last web app works smoothly on my new laptop, it does not mean that my mom will have the same experience on her not-so-old tablet.
Performances affect user experience, user retention, conversion rates and revenues (you can read some real numbers here [1]).
So worrying about performances is not “premature optimization”, but should be part of the everyday development cycle.
Google published some interesting notes about web and performances [1] with a lot of tools and suggestions to measure and improve them. You can find other examples on the same line on the web, for example, this [2] is a great case study analysis for the performances of the Walmart website. For a more detailed account, this [4] is a very valuable source, in particular if you are interested in understanding the inner workings of the Web as a platform.
A common misconception is that the only bottleneck is the network. However, even if our gzipped bundle is small for modern standards, this does not imply that users perceive a web app as fast. In fact, bundle size affects the “time to interaction”, too. So, even if gzipped transmission is fast, from a user’s perspective interaction could be still laggy and slow. The time from the point of view of users is not only the time to download the bundle, but also the time required to parse, boot and start event loop processing.
Addy Osmani gives a rule of thumb “350KB (gzipped) ~ 1MB ~ 14s until interactive”. He says that the ideal bundle size is <200KB [2]. Surprisingly, this rule matches what I observed.
If we build a new web application, we should learn and follow performance best practices. However, if we work on a legacy application, life is not always that easy. The reason is that we are not always free to follow the best practices; sometimes we need to accept compromises because a change could be too expensive or break things. How can we understand what leads to the best result with the minimal effort?
In the rest of this post, I will talk about some strategies I adopted trying to improve performances for the webshop case study I introduced here.
A case study
Let us consider, then, our webshop. In this case, the legacy Javascript is a bundle in the head section of the page. In theory, as from best practices, we could defer it, but it would not work in our case. Apparently, the legacy bundle is a dependency for some non-deferred code and seems to work only within head tags.
In addition, we know that some css is changed by the bundle, dynamically. We want to run the css scripts before the page is rendered in order to avoid glitches.
The reality is that this legacy bundle is a blob of code that we do not fully understand. It is not safe to mark it with defer or move the script tag at the end of the body.
Fortunately, there is something we can do. Performance analysis gives us some hints about what to refactor first. It turns out that a few libraries are responsible for the most performance problems. So, if we focus only on them, we can introduce a big improvement with the least effort. The rest is just some code that we can leave untouched since performance optimization would not yield a big gain. (But there could be other reasons why we want to refactor it)
Performance Analysis
In the rest of this section, I will show some data collected by WebPageTest following [1]. I am sorry but I cannot share the original data. Moreover, tests are not reproducible and could have methodological flaws.
However, even if I would not take my tests too seriously, we can easily identify some low hanging fruits.
High parsing and loading times
To get started we observe DOMContentLoaded and load. Today, other metrics are considerated more accurate to measure user experience. However, the two old events can give us a ballpark figure.
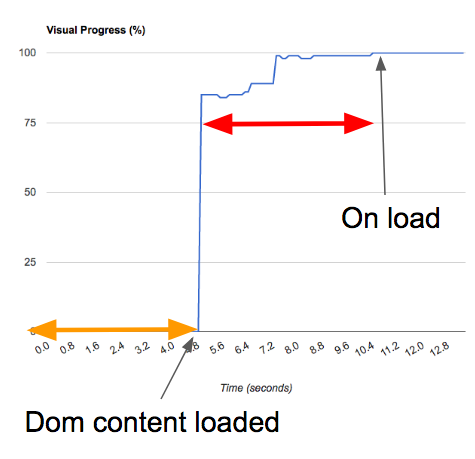
The reasons for not so good performances
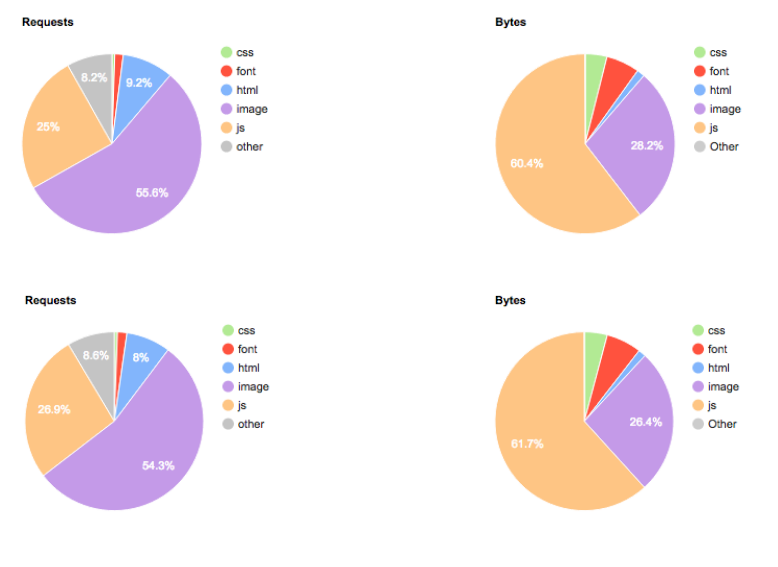
- ~55% requests for images (it increases “on load event” time), but the image size is “small”.
- 1M (60%) for Javascript! This could be the reason of the high time for on dom content loaded event.
- Javascript in
headcould block dom rendering since the browser implements a single-threaded model of execution.
How this affects user experience
- Page is blank for a few seconds on low end devices.
- Page is without images for a long time.
- Users cannot interact with the web page immediately.
A deeper look

- 1M legacy Javascript code
- A lot of unused code (js/css) on a page
Work smarter, not harder
The quick analysis suggests us that lazy loading for images and trimming the legacy bundle could reduce the problems outlined above. For now, we focus only on the latter.
Since we cannot move the bundle or defer it, we can at least try to reduce its size. In this way, even if the bundle is still a render blocking resource, the time-to-render and the time-to-interaction should decrease.
The Pareto principle or 80/20 rule says that “80% of the effects come from 20% of the causes” [5]. It is a rule of thumb that works in many cases. Let’s try to apply this law to our case.
Following the rule, the 20% of vendor libs should affect the 80% of bundle size. We have roughly 15 dependencies (1MB), 2 of them are ~80% of the total size. More or less, these are the numbers predicted by Pareto (bogus science works! ;P). The two libs are:
chance.js~250KBlibphonenumber.js~530KB
The two libraries take a lot of computing time with respect to the rest of the legacy bundle. This is the flamegraph from Chrome Dev Tools.
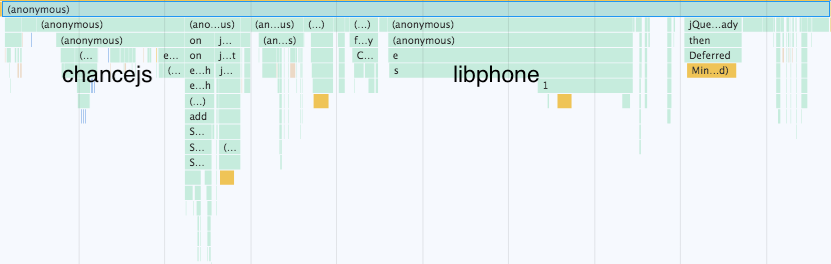
So, can we get rid of them?
First, we need to understand where the libs are used. We are lucky in this case because we can search for their occurrences in the code quite easily.
The first one, chance.js, is a collection of random generators. It is used in dev environment. So the first thought is that we can remove it from production. We can do even better. From a little code inspection, we find that we do not really need the library. So the actionable task is: remove chance.js dependency.
The second one, libphonenumber.js, is for phone number validation. It is used in a couple of forms and is huge because it is a porting of a library written in another programming language. There is a lighter version, but, in the QA process, we rely on the original Java library so we want to be 100% sure that we can validate the same phone number set. So, even if we will adopt the lighter version sooner or later, for now we have to stick with the bloated one.
It is safe to move the lib at the end of the body tag. The library is used only after DOM is rendered and users can interact with the page. We could also load the library lazily. In webpack is very easy. But for now we choose to move the lib without any other improvement.
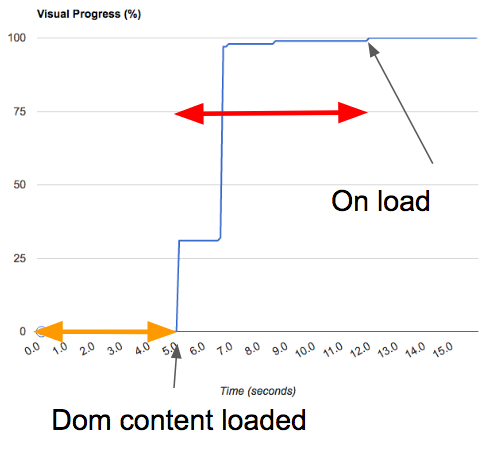
Measuring the improvement
I measured performances before and after the refactoring described in the previous section. Please take into account that other factors could have affected the change. In particular, several weeks passed between the first and the second measurement since the refactoring was not approved to production immediately. Thus, in those weeks, the webshop evolved. In few words, I did not prepare the tests in a sound way.
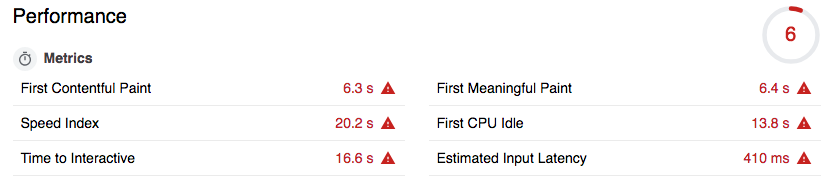
So let us take these numbers with a grain of salt. Images are screenshots from Lighthouse reports.
Lighthouse gives us more user centric metrics than WebPageTest.
Before refactoring (Emulated Nexus 5X, Simulated Slow 4G network)
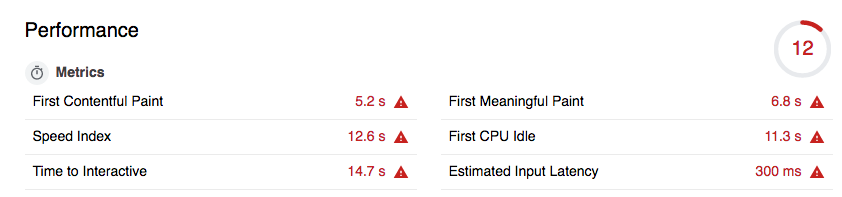
After refactoring (Emulated Nexus 5X, Simulated Slow 4G network)
How Vue can help to improve performances
We think that performances could benefit from Vue. In this section, I discuss some possible strategies and ideas.
Lazy loading
Since the webshop has a lot of images, we could use Vue for lazy loading and controlling when content is displayed.
Optimistic updates
In the majority of cases, server responses are predictable while failures are rare. For example, if a user adds a product to basket, the result of this action will increase the number of items in the navbar shopping cart with high probability.
Hence, clients can guess the effect of a request on UI and UI can be updated accordingly before an actual response is back.
When server responds, client initial guess is patched with the right behavior, if necessary.
This kind of client updates are called optimistic updates for obvious reasons.
Optimistic updates are important to improve user experience because they reduce the perceived latency in client-server communication. Users do not see loading wheels, but they get an immediate response to their actions as if the app were running locally.
With Vue and VueX is easy to implement optimistic updates.
But Vue has a cost
As Javascript, even Vue has a cost. Vue is a complex framework which introduces some overhead. For example, a Vue instance parses HTML in order to find Vue components and build render functions (if we use inline-templates). If you look at a flamegraph of your page, you can actually measure this overhead.
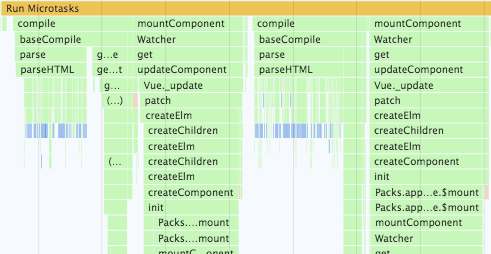
As discussed in the previous post, we had to create more Vue instances. Apparently (I am not 100% sure), from the picture above, Vue runs some parsing scripts for every instance. In the long run, we want to have just one instance. So this problem should disappear. It is ok to adopt a suboptimal solution during the first phase of a refactoring.
Webpack optimizations
As part of the refactoring, we migrated from sprocket to webpack. Webpack is an excellent tool to understand how to reduce bundle sizes. Tools like webpack-bundle-analyzer help us to understand what there actually is in our bundle. Others like tree-shaking allow us to remove dead code.
Performance budgets
While refactoring it is easy to break things. For this reason, we have regression tests. In a similar way, we need some guards to prevent us to degrade performances as a consequence of refactoring or new developments. The idea is that CI fails if assets are bigger than some thresholds. These thresholds are called performance budgets. Webpack has tools to help us define performance budgets integrated with our pipeline.
Take care
Adding a new library is easy. Fattening our bundle is much more. Thus, we should set performance budgets as first thing. Then, we should pay attention to libraries that could bloat our code base.
- Libraries designed for the server side, for example winston, tend to be bloated. We should not use them at all.
- General purpose libraries, for example lodash, have a lot of features that we do not really need always. Webpacks has tools to trim unused features, see lodash-webpack-plugin. In my experience, you can half the relative weight of lodash using that plugin.
- Validation libraries are useful, but are usually big. For example, VeeValidate is nice. If you need to validate only an email field, maybe two lines of Javascript are better than a full library.
- Finally, we should
importspecific functions instead of full libraries. Again, webpack has tools to help us also in this case.
Conclusion
Takeaways
- Web performances are important. The network is not the only bottleneck. Bundle size affects also computing and rendering time.
- Prioritize what you refactor depending on its impact on overall performances.
- Sub-optimal solutions are acceptable during refactoring.
- Performances are in the eye of the users. So techniques (lazy loading, optimistic updates) to reduce the perceived latency in client-server communication are important.
- Frameworks and libraries have a cost.
- Set performance budgets to avoid performance regressions.
- Invest in the right tools, e.g. webpack.
References
[1] Google, Web Fundamentals: performance
[2] Ivan Akulov, Case study: analyzing the Walmart site performance, 2018
[3] Addy Osmani, The cost of Javascript in 2018, 2018
[4] Ilya Grigorik, High Performance Browser Networking